
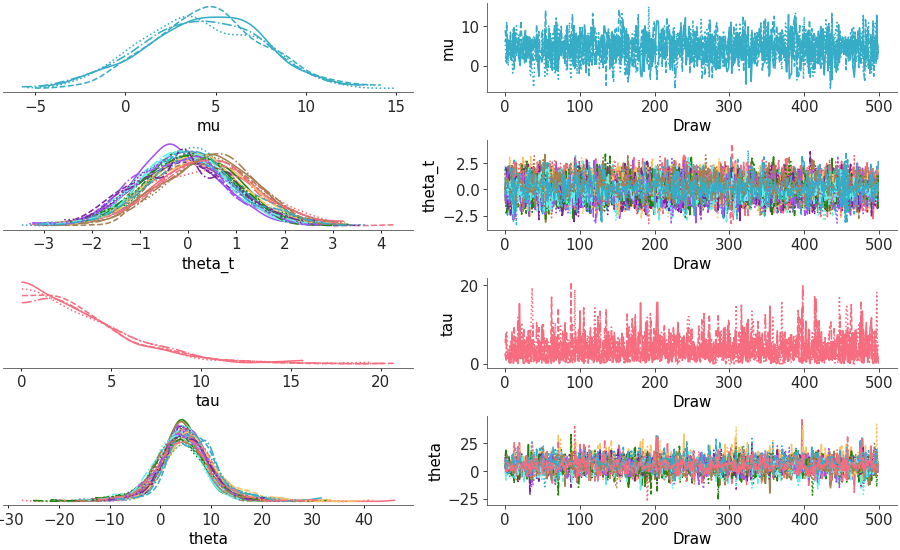
Trace and distribution plot#
Two column layout with marginal distributions on the left and MCMC traces on the right
from arviz_base import load_arviz_data
import arviz_plots as azp
azp.style.use("arviz-variat")
data = load_arviz_data("non_centered_eight")
pc = azp.plot_trace_dist(
data,
backend="none" # change to preferred backend
)
pc.show()
See also
API Documentation: plot_trace_dist