arviz_plots.plot_prior_posterior#
- arviz_plots.plot_prior_posterior(dt, var_names=None, filter_vars=None, group=None, coords=None, sample_dims=None, kind=None, plot_collection=None, backend=None, labeller=None, aes_by_visuals=None, visuals=None, stats=None, **pc_kwargs)[source]#
Plot 1D marginal densities for prior and posterior.
The Bayes factor is estimated by comparing a model (H1) against a model in which the parameter of interest has been restricted to be a point-null (H0) This computation assumes the models are nested and thus H0 is a special case of H1.
- Parameters:
- dt
xarray.DataTreeordictof {strxarray.DataTree} Input data. In case of dictionary input, the keys are taken to be model names. In such cases, a dimension “model” is generated and can be used to map to aesthetics.
- var_names
strorlistofstr, optional One or more variables to be plotted. Prefix the variables by ~ when you want to exclude them from the plot.
- filter_vars{
None, “like”, “regex”}, default=None If None, interpret var_names as the real variables names. If “like”, interpret var_names as substrings of the real variables names. If “regex”, interpret var_names as regular expressions on the real variables names.
- group
None This argument is ignored. Have it here for compatibility with other plotting functions.
- coords
dict, optional - sample_dims
stror sequence of hashable, optional Dimensions to reduce unless mapped to an aesthetic. Defaults to
rcParams["data.sample_dims"]- kind{“kde”, “hist”, “dot”, “ecdf”}, optional
How to represent the marginal density. Defaults to
rcParams["plot.density_kind"]- plot_collection
PlotCollection, optional - backend{“matplotlib”, “bokeh”}, optional
- labeller
labeller, optional - aes_by_visualsmapping of {
strsequence ofstr}, optional Mapping of visuals to aesthetics that should use their mapping in
plot_collectionwhen plotted. The prior and posterior groups are combined creating a new dimension “group”. By default, there is an aesthetic mapping from group to color. Valid keys are the same as forvisuals.- visualsmapping of {
strmapping orFalse}, optional Valid keys are:
dist -> depending on the value of kind passed to:
title -> passed to
labelled_titlelegend -> passed to
arviz_plots.PlotCollection.add_legend
- statsmapping, optional
Valid keys are:
dist -> passed to kde, ecdf, …
- **pc_kwargs
Passed to
arviz_plots.PlotCollection.wrap
- dt
- Returns:
Examples
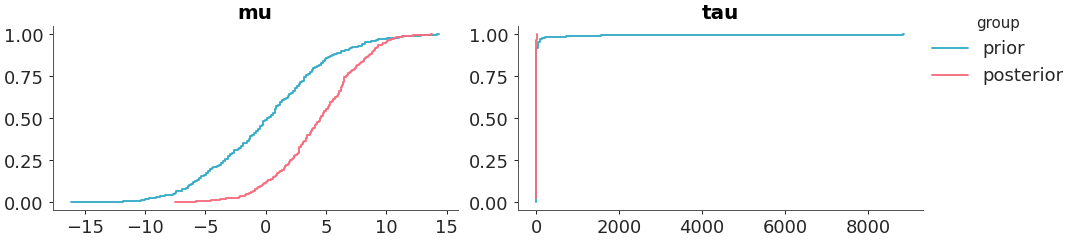
Select two variables and plot them with a ecdf.
>>> from arviz_plots import plot_prior_posterior, style
>>> style.use("arviz-variat")
>>> from arviz_base import load_arviz_data
>>> dt = load_arviz_data('centered_eight')
>>> plot_prior_posterior(dt, var_names=["mu", "tau"], kind="ecdf")