arviz_plots.add_bands#
- arviz_plots.add_bands(plot_collection, values, orientation='vertical', aes_by_visuals=None, visuals=None, sample_dims=None, ref_dim=None, **kwargs)[source]#
Add bands.
This function adds bands (shared areas) to a plot collection based on the provided values. It supports both vertical and horizontal bands, depending on the specified orientation.
- Parameters:
- plot_collection
PlotCollection Plot collection to which the bands will be added.
- values
tuple,listordict Start and end values for the bands to be plotted.
- orientation
str, default “vertical” The orientation of the bands, either “vertical” or “horizontal”.
- aes_by_visualsmapping of {
strsequence ofstr}, optional Mapping of visuals to aesthetics that should use their mapping in
plot_collectionwhen plotted. Valid keys are the same as forvisuals.The default is to use an “overlay_band” aesthetic for all elements.
It is possible to request aesthetics without mappings defined in the provided
plot_collection. In those cases, a mapping of the dimensions in ref_dim minus its last element to the requested aesthetic will be automatically added.- visualsmapping of {
strmapping orFalse}, optional Valid keys are:
- sample_dims
list, optional Dimensions that should not be added to the Dataset generated from values via
arviz_base.references_to_dataset. Defaults to all dimensions inplot_collection.datathat are notfacet_dims- ref_dim
list, optional List of dimension names that define the axes along which the band values are stored. These dimensions are used to align or compare input data with band data. Defaults to [“ref_dim”, “band_dim”].
- **kwargssequence, optional
Mapping of aesthetic keys to the values to be used in their mapping. See
generate_aes_dtfor more details.
- plot_collection
- Returns:
- plot_collection
PlotCollection Plot collection with the bands added.
- plot_collection
Examples
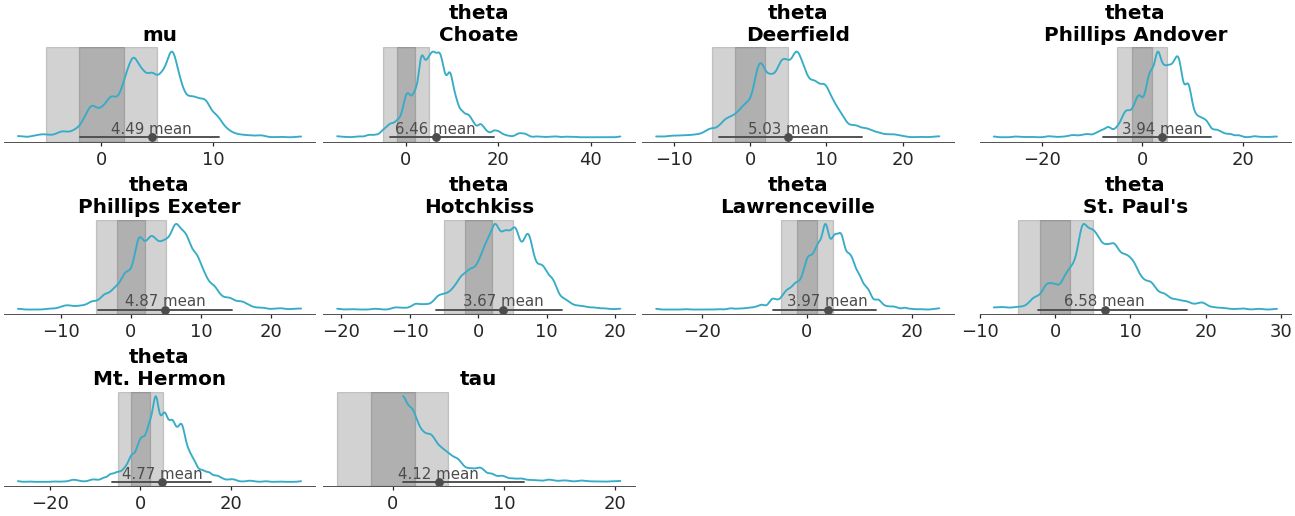
Add two bands for the theta variable, one from -2 to 2 and the other from -5 to 5.
>>> from arviz_plots import plot_dist, add_bands, style
>>> style.use("arviz-variat")
>>> from arviz_base import load_arviz_data
>>> dt = load_arviz_data('centered_eight')
>>> pc = plot_dist(dt)
>>> add_bands(pc, values=[[-2, 2], [-5, 5]])