arviz_plots.combine_plots#
- arviz_plots.combine_plots(dt, plots, var_names=None, filter_vars=None, group='posterior', coords=None, sample_dims=None, expand='column', plot_names=None, backend=None, **pc_kwargs)[source]#
Arrange multiple batteries-included plots in a customizable column or row layout.
- Parameters:
- dt
xarray.DataTreeofdictof {strxarray.DataTree} Input data. In case of dictionary input, the keys are taken to be model names. In such cases, a dimension “model” is generated and can be used to map to aesthetics.
Note that not all batteries included functions accept dictionary input, so it will only work when all plotting functions requested in
plotsare compatible with it.- plots
listoftupleof (callable, mapping) List of all the plotting functions to be combined. Each element in this list is a tuple with two elements. The first is the function to be called, the second is a dictionary with any keyword arguments that should be used when calling that function.
- var_names
stror sequence ofstr, optional One or more variables to be plotted. Prefix the variables by ~ when you want to exclude them from the plot.
- filter_vars{
None, “like”, “regex”}, defaultNone If None, interpret var_names as the real variables names. If “like”, interpret var_names as substrings of the real variables names. If “regex”, interpret var_names as regular expressions on the real variables names.
- group
str, default “posterior” Group to be plotted.
- coords
dict, optional - sample_dims
stror sequence of hashable, optional Dimensions to reduce unless mapped to an aesthetic. Defaults to
rcParams["data.sample_dims"]- expand{“column”, “row”}, default “column”
How to combine the different plotting functions. If “column”, each plotting function will be added as a new column, if “row” it will be a new row instead.
- plot_names
listofstr, optional List of the same length as
plotswith the plot names to use as coordinate values in the returnedPlotCollection.- backend{“matplotlib”, “bokeh”, “plotly”}, optional
Plotting backend to use. Defaults to
rcParams["plot.backend"].- **pc_kwargs
Passed to
arviz_plots.PlotCollection.grid
- dt
- Returns:
Examples
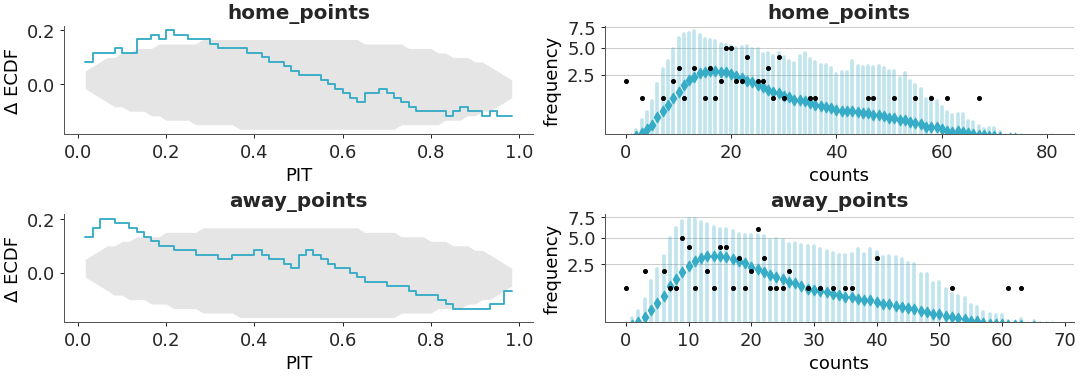
Customize the names of the plots in the returned
PlotCollection>>> import arviz_plots as azp >>> azp.style.use("arviz-variat") >>> from arviz_base import load_arviz_data >>> rugby = load_arviz_data('rugby') >>> pc = azp.combine_plots( >>> rugby, >>> plots=[ >>> (azp.plot_ppc_pit, {}), >>> (azp.plot_ppc_rootogram, {}), >>> ], >>> group="posterior_predictive", >>> plot_names=["pit", "rootogram"], >>> )
Now if we inspect the
pc.vizattribute, we can see it has acolumndimension with the requested coordinate values:>>> pc.viz