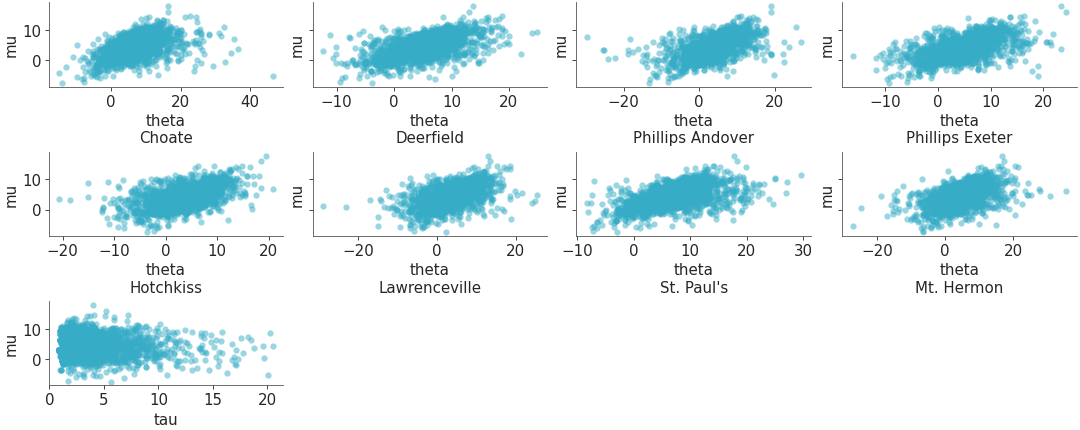
Scatter plot of one variable against all other variables with divergences#
Plot one variable against other variables in the dataset.
import numpy as np
from arviz_base import load_arviz_data
import arviz_plots as azp
azp.style.use("arviz-variat")
dt = load_arviz_data("centered_eight")
dt.posterior["log_tau"] = np.log(dt.posterior["tau"])
pc = azp.plot_pair_focus(
dt,
var_names=["theta"],
focus_var="log_tau",
visuals={"divergence":True},
backend="none", # change to preferred backend
)
pc.show()
See also
API Documentation: plot_pair_focus
Other examples with plot_pair_focus#


