
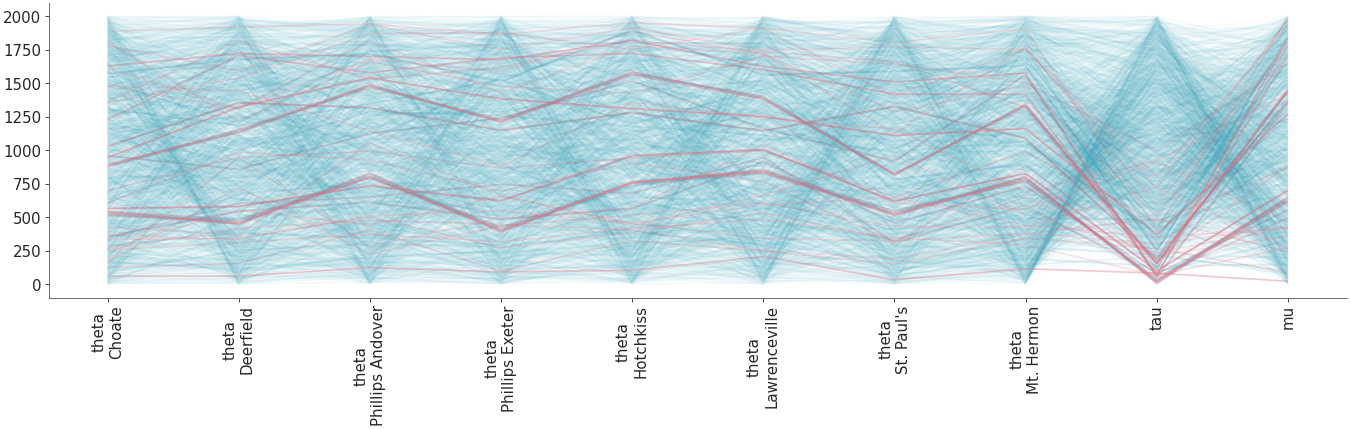
Parallel coordinates plot#
Plot parallel coordinates plot showing posterior points with divergences..
import numpy as np
from arviz_base import load_arviz_data

import arviz_plots as azp

azp.style.use("arviz-variat")

dt = load_arviz_data("centered_eight")
pc = azp.plot_parallel(
    dt,
    var_names=["theta","tau","mu"],
    norm_method="rank",
    label_type="vert",
    backend="none", # change to preferred backend
)
pc.show()
See also
API Documentation: plot_parallel