arviz_plots.add_lines#
- arviz_plots.add_lines(plot_collection, values, orientation='vertical', aes_by_visuals=None, visuals=None, sample_dims=None, ref_dim='ref_dim', **kwargs)[source]#
Add lines.
This function adds lines to a plot collection based on the provided values. It supports both vertical and horizontal lines, depending on the specified orientation.
- Parameters:
- plot_collection
PlotCollection Plot collection to which the lines will be added.
- values
int,float,tuple,listordict Positions for the lines.
- orientation
str, default “vertical” The orientation of the lines, either “vertical” or “horizontal”.
- aes_by_visualsmapping of {
strsequence ofstr}, optional Mapping of visuals to aesthetics that should use their mapping in
plot_collectionwhen plotted. Valid keys are the same as forvisuals.The default is to use an “overlay_ref” aesthetic for all elements.
It is possible to request aesthetics without mappings defined in the provided
plot_collection. In those cases, a mapping of “ref_dim” to the requested aesthetic will be automatically added.- visualsmapping of {
strmapping orFalse}, optional Valid keys are:
- sample_dims
list, optional Dimensions that should not be added to the Dataset generated from values via
arviz_base.references_to_dataset. Defaults to all dimensions inplot_collection.datathat are notfacet_dims- ref_dim
str, optional Specifies the name of the dimension for the line values. Defaults to “ref_dim”.
- **kwargsmapping of {
strsequence}, optional Mapping of aesthetic keys to the values to be used in their mapping. See
generate_aes_dtfor more details.
- plot_collection
- Returns:
- plot_collection
PlotCollection Plot collection with the lines added.
- plot_collection
Examples
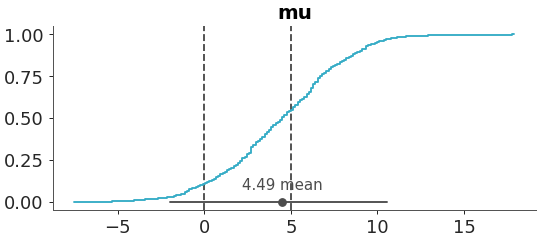
Add lines at values 0 and 5 for all variables.
>>> from arviz_plots import plot_dist, add_lines, style
>>> style.use("arviz-variat")
>>> from arviz_base import load_arviz_data
>>> dt = load_arviz_data('centered_eight')
>>> pc = plot_dist(
>>>     dt,
>>>     kind="ecdf",
>>>     var_names=["mu"],
>>> )
>>> add_lines(pc, values=[0, 5])