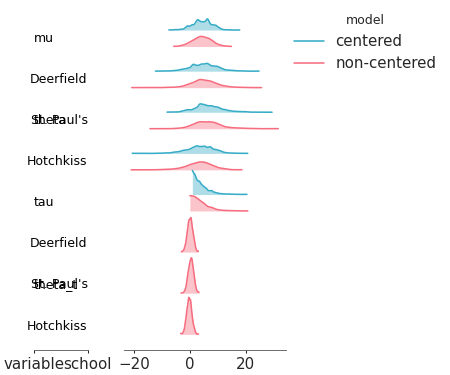
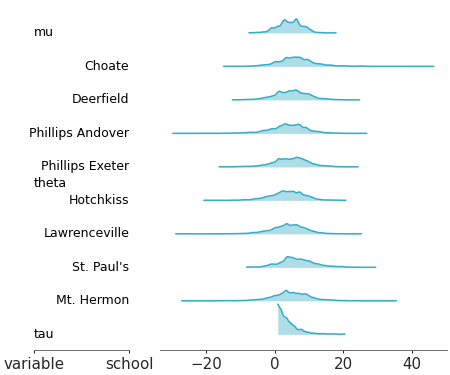
Ridge plot#
Visual representation of marginal distributions over the y axis for a single model
from arviz_base import load_arviz_data
import arviz_plots as azp
azp.style.use("arviz-variat")
data = load_arviz_data("centered_eight")
pc = azp.plot_ridge(
data,
backend="none" # change to preferred backend
)
pc.show()
See also
API Documentation: plot_ridge
Other examples with plot_ridge#