
Sensitivity posterior quantities#
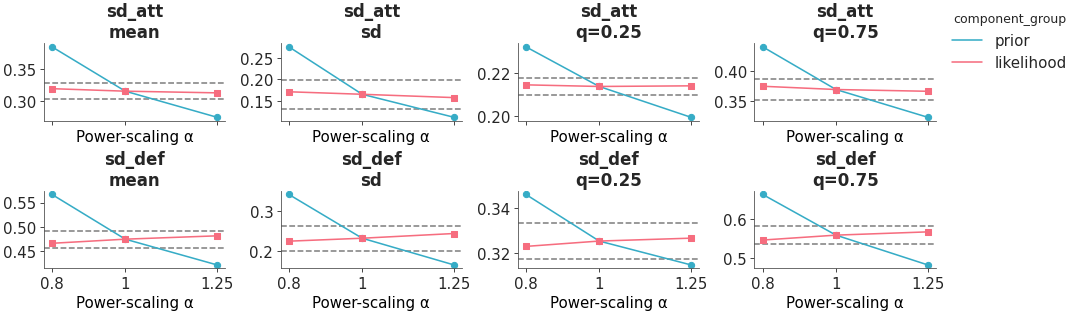
The posterior quantities are computed by power-scaling the prior or likelihood and visualizing the resulting changes. Sensitivity can then be quantified by considering how much the perturbed quantities differ from the base quantities.
from arviz_base import load_arviz_data

import arviz_plots as azp

azp.style.use("arviz-variat")

idata = load_arviz_data("rugby")
pc = azp.plot_psense_quantities(
    idata,
    var_names=["sd_att", "sd_def"],
    quantities=["mean", "sd", "0.25", "0.75"],
    backend="none",
)
pc.show()
See also
API Documentation: plot_psense_quantities