Add Lines#
Draw lines on plots to highlight specific thresholds, targets, or important values.
from arviz_base import load_arviz_data
import arviz_plots as azp
azp.style.use("arviz-variat")
data = load_arviz_data("centered_eight")
ref_ds = data.posterior.dataset.quantile([0.5, 0.1, 0.9], dim=["chain", "draw"])
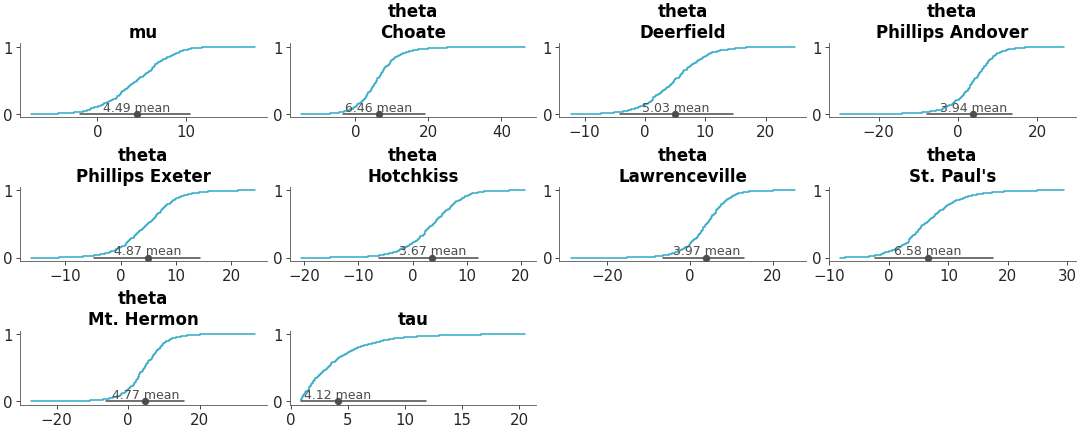
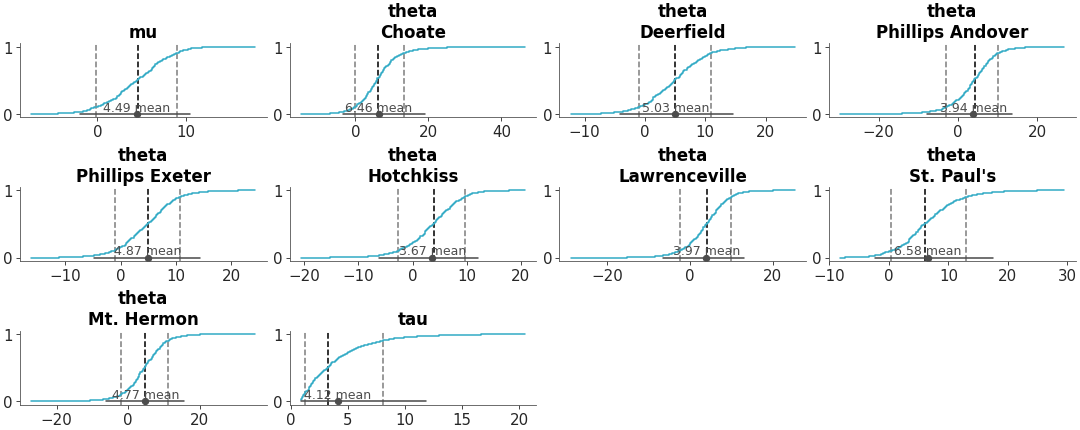
pc = azp.plot_dist(
data,
kind="ecdf",
backend="none", # change to preferred backend
)
pc = azp.add_lines(
pc,
values=ref_ds,
ref_dim="quantile",
aes_by_visuals={"ref_line": ["color"]},
color=["black", "gray", "gray"]
)
pc.show()
See also
API Documentation: add_lines
Other examples with plot_dist#