arviz_plots.plot_autocorr#
- arviz_plots.plot_autocorr(dt, var_names=None, filter_vars=None, group='posterior', coords=None, sample_dims=None, max_lag=None, plot_collection=None, backend=None, labeller=None, aes_by_visuals=None, visuals=None, **pc_kwargs)[source]#
Autocorrelation plots for the given dataset.
Line plot of the autocorrelation function (ACF)
The ACF plots can be used as a convergence diagnostic for posteriors from MCMC samples.
- Parameters:
- dt
xarray.DataTree Input data
- var_names
strorlistofstr, optional One or more variables to be plotted. Currently only one variable is supported. Prefix the variables by ~ when you want to exclude them from the plot.
- filter_vars{
None, “like”, “regex”}, optional, default=None If None (default), interpret var_names as the real variables names. If “like”, interpret var_names as substrings of the real variables names. If “regex”, interpret var_names as regular expressions on the real variables names.
- group
str, optional Which group to use. Defaults to “posterior”.
- coords
dict, optional Coordinates to plot.
- sample_dims
stror sequence of hashable, optional Dimensions to reduce unless mapped to an aesthetic. Defaults to
rcParams["data.sample_dims"]- max_lag
int, optional Maximum lag to compute the ACF. Defaults to 100.
- plot_collection
PlotCollection, optional - backend{“matplotlib”, “bokeh”, “plotly”}, optional
- labeller
labeller, optional - aes_by_visualsmapping of {
strsequence ofstr}, optional Mapping of visuals to aesthetics that should use their mapping in
plot_collectionwhen plotted. Valid keys are the same as forvisuals.- visualsmapping of {
strmapping orFalse}, optional Valid keys are:
lines -> passed to
ecdf_lineref_line -> passed to
line_xycredible_interval -> passed to
fill_between_yxlabel -> passed to
labelled_xtitle -> passed to
labelled_title
- **pc_kwargs
Passed to
arviz_plots.PlotCollection.grid
- dt
- Returns:
Examples
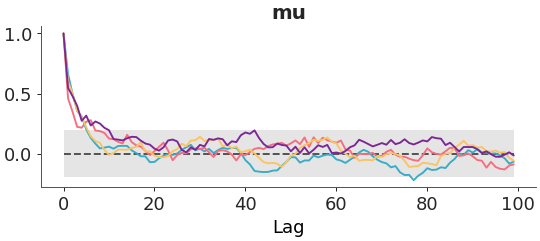
Autocorrelation plot for mu variable in the centered eight dataset.
>>> from arviz_plots import plot_autocorr, style
>>> style.use("arviz-variat")
>>> from arviz_base import load_arviz_data
>>> dt = load_arviz_data('centered_eight')
>>> plot_autocorr(dt, var_names=["mu"])