arviz_plots.plot_pair#
- arviz_plots.plot_pair(dt, var_names=None, filter_vars=None, group='posterior', coords=None, sample_dims=None, marginal=True, marginal_kind=None, triangle='lower', plot_matrix=None, backend=None, labeller=None, aes_by_visuals=None, visuals=None, stats=None, **pc_kwargs)[source]#
Plot all variables against each other in the dataset.
- Parameters:
- dt
xarray.DataTree Input data
- var_names: str or list of str, optional
One or more variables to be plotted. Prefix the variables by ~ when you want to exclude them from the plot.
- filter_vars: {None, “like”, “regex”}, default None
If None (default), interpret var_names as the real variables names. If “like”, interpret var_names as substrings of the real variables names. If “regex”, interpret var_names as regular expressions on the real variables names.
- group
str, default “posterior” Group to use for plotting. Defaults to “posterior”.
- coordsmapping, optional
Coordinates to use for plotting.
- sample_dimsiterable, optional
Dimensions to reduce unless mapped to an aesthetic. Defaults to
rcParams["data.sample_dims"]- marginalbool, default
True Whether to plot marginal distributions on the diagonal.
- marginal_kind{“kde”, “hist”, “ecdf”}, optional
How to represent the marginal density. Defaults to
rcParams["plot.density_kind"]- triangle{“both”, “upper”, “lower”},
Defaultsto“both” Which triangle of the pair plot to plot.
- plot_matrix
PlotMatrix, optional - backend{“matplotlib”, “bokeh”, “plotly”, “none”}, optional
Plotting backend to use. Defaults to
rcParams["plot.backend"]- labeller
labeller, optional - aes_by_visualsmapping, optional
Mapping of visuals to aesthetics that should use their mapping in
plot_matrixwhen plotted. Valid keys are the same as forvisuals. By default, there are no aesthetic mappings at all- visualsmapping of {
strmapping orFalse}, optional Valid keys are:
scatter -> passed to
scatter_coupledivergence -> passed to
scatter_couple. Defaults to False.dist -> depending on the value of marginal_kind passed to:
credible_interval -> passed to
line_xpoint_estimate -> passed to
scatter_xpoint_estimate_text -> passed to
point_estimate_textlabel -> Keyword arguments passed to
label_plot.Used to customize the variable name labels on the diagonal. Applied only if
marginal=False.xlabel -> passed to
labelled_x.used to customize the xaxis labels on the bottom-most plots or diagonal plots depending upon the value of
triangle. Iftriangleis “lower” or “both” then it is used to map bottom-most row plots by usingarviz_plots.PlotMatrix.map_rowmethod and iftriangleis “upper” then it is used to map diagonal plots by usingarviz_plots.PlotMatrix.mapmethod.It is applied only ifmarginal=True, since in this case diagonal plots won’t have labels to map variables to columns.ylabel -> passed to
labelled_y.used to customize the yaxis labels on the left-most plots. It is applied, only if
triangleis “lower” or “both” andmarginal=True, by usingarviz_plots.PlotMatrix.map_colmethod. Not applied iftriangleis “upper” ormarginal=False.remove_axis -> not passed anywhere.
It can only be set to
Falseto disable the default removal ofxandyaxes from the plots of other half triangle. Iftriangleis “upper” then the lower triangle plot’s axes will be removed and iftriangleis “lower” then the upper triangle axes will be removed, in case if it is not setFalsemanually.
- statsmapping, optional
Valid keys are:
dist -> passed to kde, ecdf, …
credible_interval -> passed to eti or hdi
point_estimate -> passed to mean, median or mode
- **pc_kwargs
Passed to
arviz_plots.PlotMatrix
- dt
- Returns:
Examples
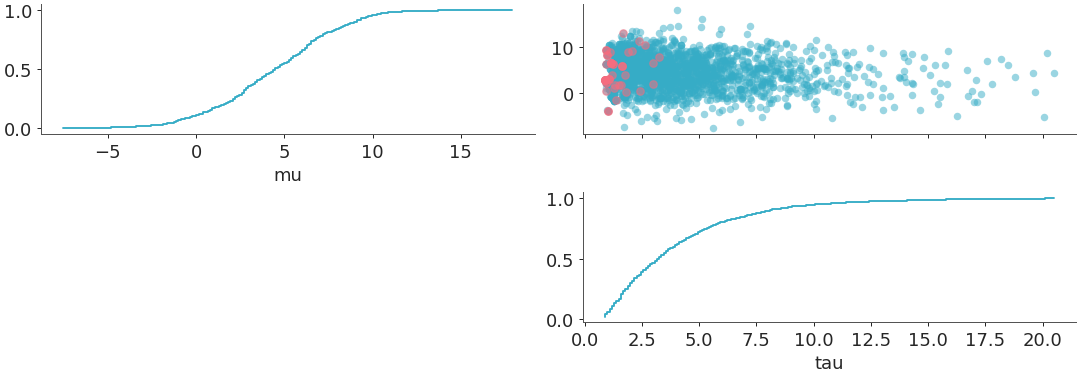
plot_pair with
triangleset to “upper” andmarginal=Truewithmarginal_kindset to “ecdf”. In this case, sincetriangleis “upper”, so thexlabelsare mapped to the diagonal plots.marginalsare plotted on the diagonal and thepoint_estimateandcredible_intervalare set toFalseby default. Also sincemarginal=True, sosharexis set to “col”, whileshareyis not set to anything by default.>>> from arviz_plots import plot_pair, style >>> style.use("arviz-variat") >>> from arviz_base import load_arviz_data >>> dt = load_arviz_data('centered_eight') >>> plot_pair( >>> dt, >>> var_names=["mu", "tau"], >>> visuals={"divergence": True}, >>> marginal=True, >>> marginal_kind="ecdf", >>> triangle="upper", >>> )
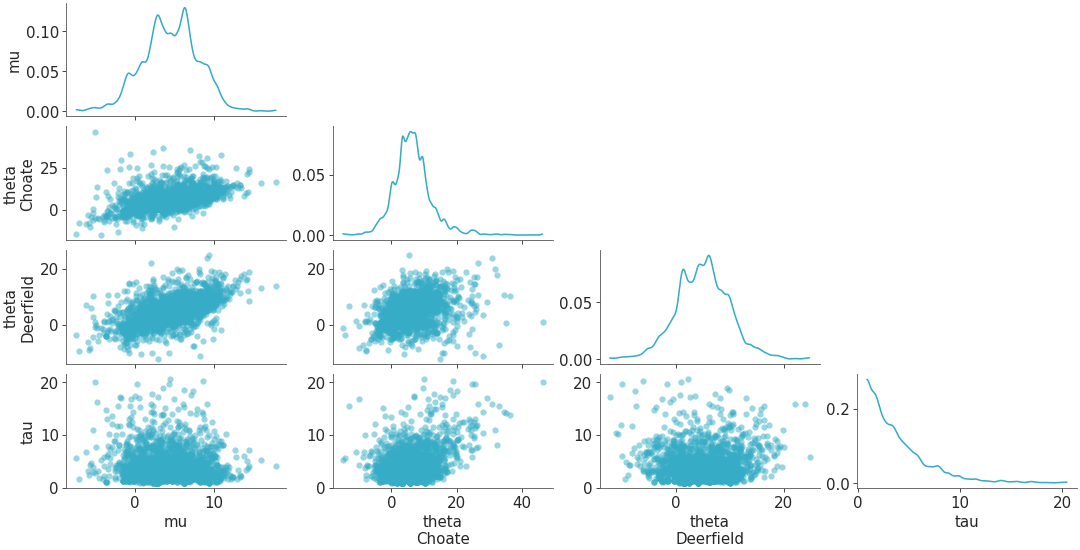
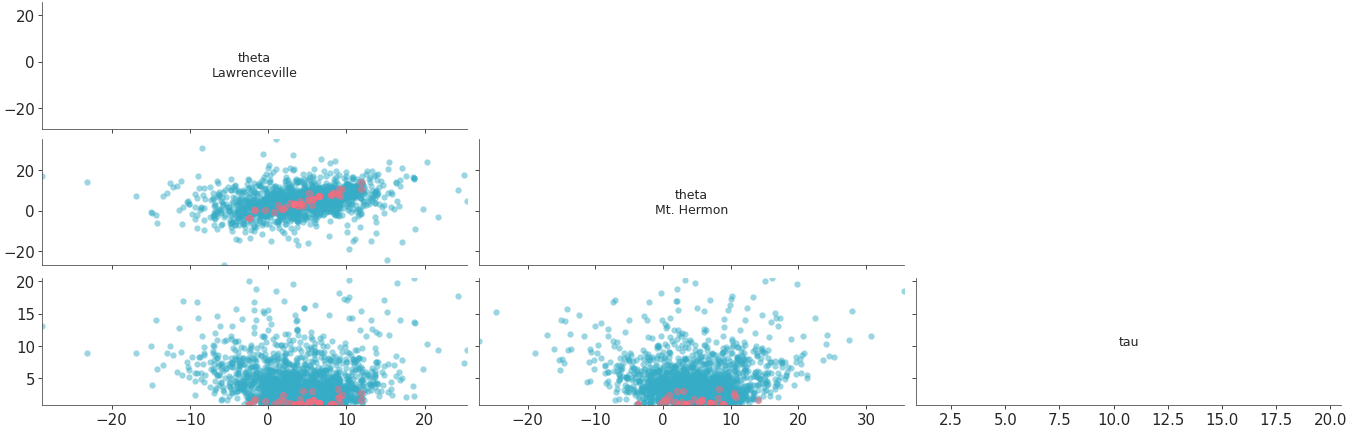
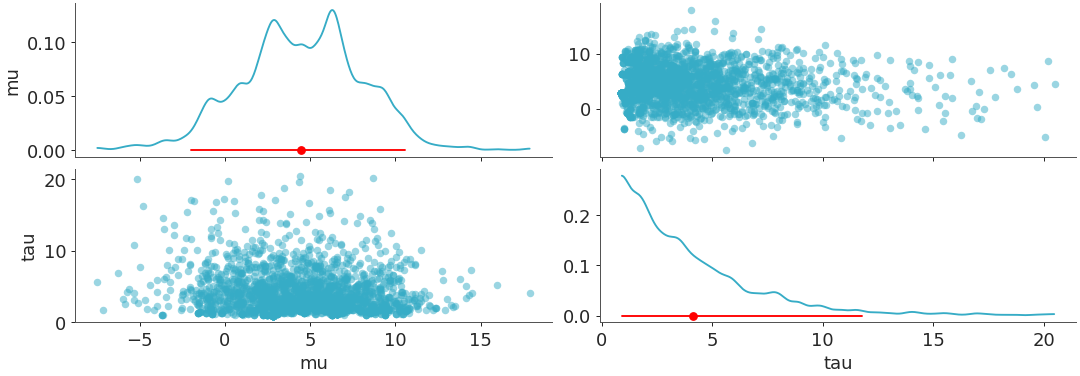
plot_pair with triangle set to “both”, so in this case the
xlabelsare mapped to the bottom-most plots andylabelsare mapped to the left-most plots. In this example we setcoloras “red” forcredible_intervalandpoint_estimate, which enablescredible_intervalandpoint_estimate. By defaultmarginalis set toTrueandmarginal_kindis set torcParams["plot.density_kind"].>>> visuals = {"credible_interval":{"color":"red"},"point_estimate":{"color":"red"}} >>> plot_pair( >>> dt, >>> var_names=["mu", "tau"], >>> visuals=visuals, >>> triangle="both", >>> )
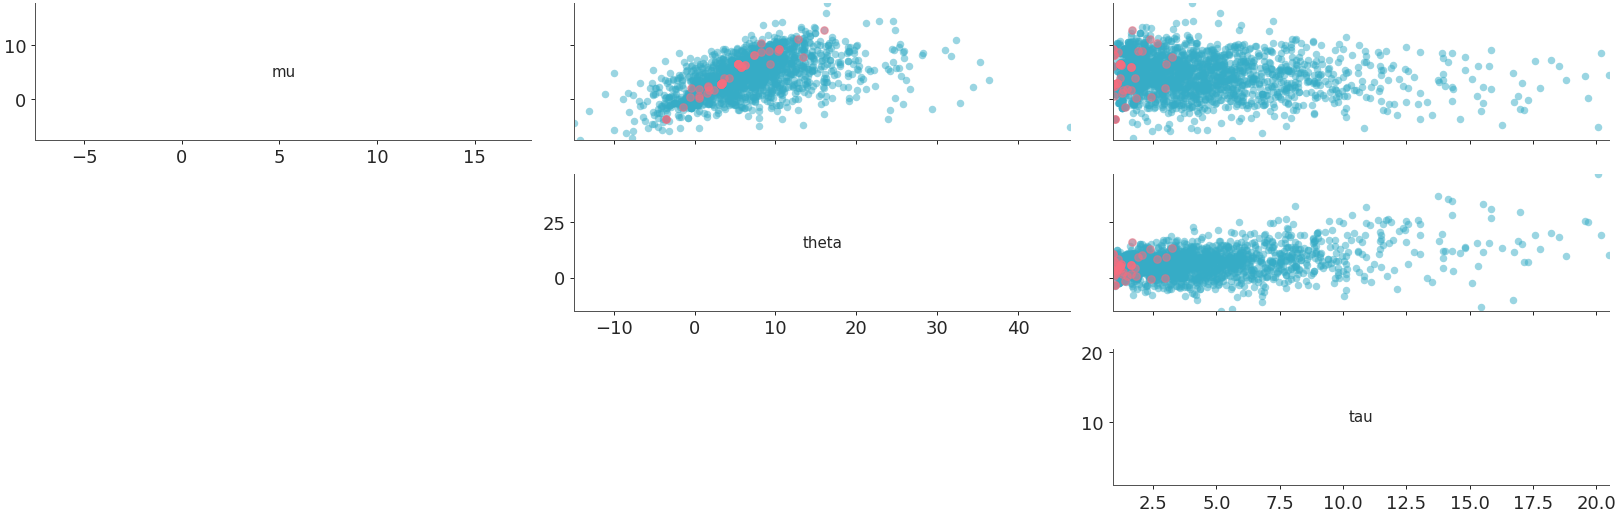
plot_pair with
marginal=Falseandtriangleset to “upper”. In this case, sincemarginal=False, soxlabelandylabelare disabled by default, and diagonal plots contain variable names as labels.xticksandyticksare also set on diagonal plots along withticklabels, to map ticks to rows and columns. Sincemarginal=False, sosharexis set to “col” andshareyis set to “row” by default.>>> plot_pair( >>> dt, >>> coords = {"school":"Choate"}, >>> visuals={"divergence": True}, >>> marginal=False, >>> triangle="upper", >>> )