arviz_plots.plot_bf#
- arviz_plots.plot_bf(dt, var_names, ref_val=0, kind=None, sample_dims=None, plot_collection=None, backend=None, labeller=None, aes_by_visuals=None, visuals=None, stats=None, **pc_kwargs)[source]#
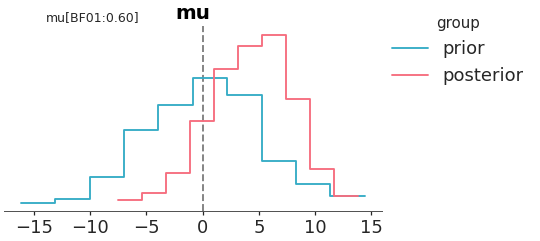
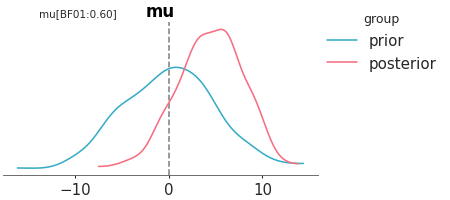
Bayes Factor for comparing hypothesis of two nested models.
The Bayes factor is estimated by comparing a model (H1) against a model in which the parameter of interest has been restricted to be a point-null (H0) This computation assumes H0 is a special case of H1. For more details see here https://arviz-devs.github.io/EABM/Chapters/Model_comparison.html#savagedickey-ratio
- Parameters:
- dt
xarray.DataTreeordictof {strxarray.DataTree} Input data. In case of dictionary input, the keys are taken to be model names. In such cases, a dimension “model” is generated and can be used to map to aesthetics.
- var_names
str, optional Variables for which the bayes factor will be computed and the prior and posterior will be plotted.
- ref_val
intorfloat, default 0 Reference (point-null) value for Bayes factor estimation.
- kind{“kde”, “hist”, “dot”, “ecdf”}, optional
How to represent the marginal density. Defaults to
rcParams["plot.density_kind"]- sample_dims
stror sequence of hashable, optional Dimensions to reduce unless mapped to an aesthetic. Defaults to
rcParams["data.sample_dims"]- plot_collection
PlotCollection, optional - backend{“matplotlib”, “bokeh”, “plotly”}, optional
- labeller
labeller, optional - aes_by_visualsmapping of {
strsequence ofstr}, optional Mapping of visuals to aesthetics that should use their mapping in
plot_collectionwhen plotted. Valid keys are the same as forvisuals.- visualsmapping of {
strmapping orFalse}, optional Valid keys are:
dist -> depending on the value of kind passed to:
ref_line -> passed to :func:
vlinetitle -> passed to
labelled_titlelegend -> passed to
arviz_plots.PlotCollection.add_legend
- statsmapping, optional
Valid keys are:
dist -> passed to kde, ecdf, …
- **pc_kwargs
Passed to
arviz_plots.PlotCollection.wrap
- dt
- Returns:
Examples
Select one variable.
>>> from arviz_plots import plot_bf, style
>>> style.use("arviz-variat")
>>> from arviz_base import load_arviz_data
>>> dt = load_arviz_data('centered_eight')
>>> plot_bf(dt, var_names="mu", kind="hist")