
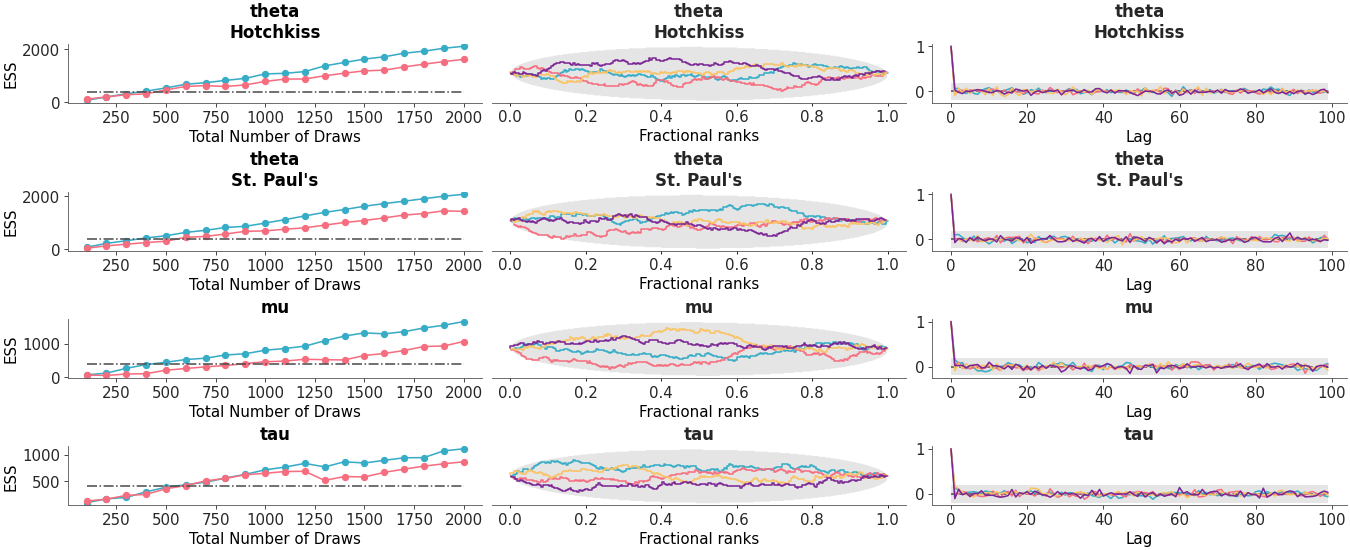
Custom diagnostic plots combination#
Arrange three diagnostic plots (ESS evolution plot, rank plot and autocorrelation plot) in a custom column layout.
from arviz_base import load_arviz_data

import arviz_plots as azp

azp.style.use("arviz-variat")

data = load_arviz_data("non_centered_eight")
pc = azp.combine_plots(
    data,
    [
        (azp.plot_ess_evolution, {}),
        (azp.plot_rank, {}),
        (azp.plot_autocorr, {}),
    ],
    var_names=["theta", "mu", "tau"],
    coords={"school": ["Hotchkiss", "St. Paul's"]},
    backend="none",  # change to preferred backend
)
pc.show()
See also
API Documentation: combine_plots