
Energy#
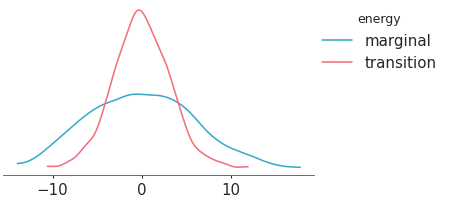
Plot transition and marginal energy distributions
from arviz_base import load_arviz_data

import arviz_plots as azp

azp.style.use("arviz-variat")

data = load_arviz_data("centered_eight")
pc = azp.plot_energy(
    data,
    backend="none"  # change to preferred backend
)
pc.show()
See also
API Documentation: plot_energy