arviz_plots.plot_pair_focus#
- arviz_plots.plot_pair_focus(dt, focus_var, focus_var_coords=None, var_names=None, filter_vars=None, group='posterior', coords=None, sample_dims=None, plot_collection=None, backend=None, labeller=None, aes_by_visuals=None, visuals=None, **pc_kwargs)[source]#
Plot a fixed variable against other variables in the dataset.
- Parameters:
- dt
xarray.DataTree Input data
- focus_var: str or DataArray
Name of the variable or DataArray to be plotted against all other variables.
- focus_var_coordsmapping, optional
Coordinates to use for the target variable.
- var_names: str or list of str, optional
One or more variables to be plotted. Prefix the variables by ~ when you want to exclude them from the plot.
- filter_vars: {None, “like”, “regex”}, default None
If None (default), interpret var_names as the real variables names. If “like”, interpret var_names as substrings of the real variables names. If “regex”, interpret var_names as regular expressions on the real variables names.
- group
str, default “posterior” Group to use for plotting. Defaults to “posterior”.
- coordsmapping, optional
Coordinates to use for plotting.
- sample_dimsiterable, optional
Dimensions to reduce unless mapped to an aesthetic. Defaults to
rcParams["data.sample_dims"]- plot_collection
PlotCollection, optional - backend{“matplotlib”, “bokeh”, “plotly”, “none”}, optional
Plotting backend to use. Defaults to
rcParams["plot.backend"]- labeller
labeller, optional - aes_by_visualsmapping, optional
Mapping of visuals to aesthetics that should use their mapping in
plot_collectionwhen plotted. Valid keys are the same as forvisuals. By default, there are no aesthetic mappings at all- visualsmapping of {
strmapping orFalse}, optional Valid keys are:
scatter -> passed to
scatter_xdivergence -> passed to
scatter_xy. Defaults to False.xlabel ->
labelled_xylabel ->
labelled_y
- **pc_kwargs
Passed to
arviz_plots.PlotCollection.wrap
- dt
- Returns:
Examples
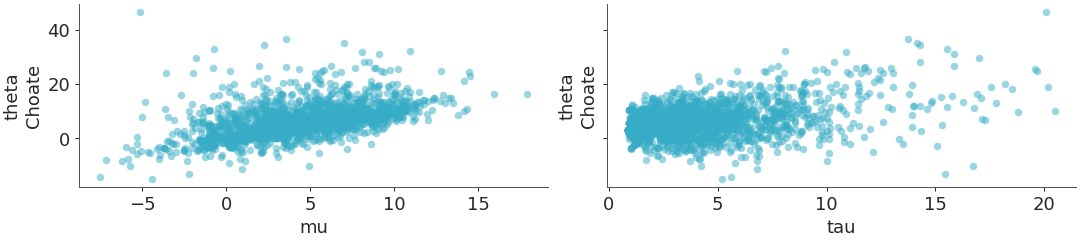
Default plot_pair_focus
>>> from arviz_plots import plot_pair_focus, style
>>> style.use("arviz-variat")
>>> from arviz_base import load_arviz_data
>>> dt = load_arviz_data('centered_eight')
>>> plot_pair_focus(
>>>     dt,
>>>     var_names=["mu", "tau"],
>>>     focus_var="theta",
>>>     focus_var_coords={"school": "Choate"},
>>> )