arviz_plots.plot_parallel#
- arviz_plots.plot_parallel(dt, var_names=None, filter_vars=None, group='posterior', coords=None, sample_dims=None, norm_method=None, label_type='flat', plot_collection=None, backend=None, labeller=None, aes_by_visuals=None, visuals=None, **pc_kwargs)[source]#
Plot parallel coordinates plot showing posterior points with and without divergences.
- Parameters:
- dt
xarray.DataTree Input data
- var_names: str or list of str, optional
One or more variables to be plotted. Prefix the variables by ~ when you want to exclude them from the plot.
- filter_vars: {None, “like”, “regex”}, default None
If None (default), interpret var_names as the real variables names. If “like”, interpret var_names as substrings of the real variables names. If “regex”, interpret var_names as regular expressions on the real variables names.
- group
str, default “posterior” Group to use for plotting. Defaults to “posterior”.
- coordsmapping, optional
Coordinates to use for plotting.
- sample_dimsiterable, optional
Dimensions to reduce unless mapped to an aesthetic. Defaults to
rcParams["data.sample_dims"]- norm_method{
None, “normal”, “minmax”, “rank”}, defaultNone Transformation to apply to the samples before plotting.
- label_type{“flat”, “vert”}, default “flat”
Indicator of which labeller method to use when generating the labels of the x axis.
- plot_collection
PlotCollection, optional - backend{“matplotlib”, “bokeh”, “plotly”, “none”}, optional
Plotting backend to use. Defaults to
rcParams["plot.backend"]- labeller
labeller, optional - aes_by_visualsmapping, optional
Mapping of visuals to aesthetics that should use their mapping in
plot_collectionwhen plotted. Valid keys are the same as forvisuals. By default, there is a mapping from the value of diverging variable to color and alpha which is only active for the “line” visual.- visualsmapping of {
strmapping orFalse}, optional Valid keys are:
line -> passed to
multiple_linesxticks -> passed to
set_xticks. Defaults to False.
- **pc_kwargs
Passed to
arviz_plots.PlotCollection.wrap
- dt
- Returns:
Examples
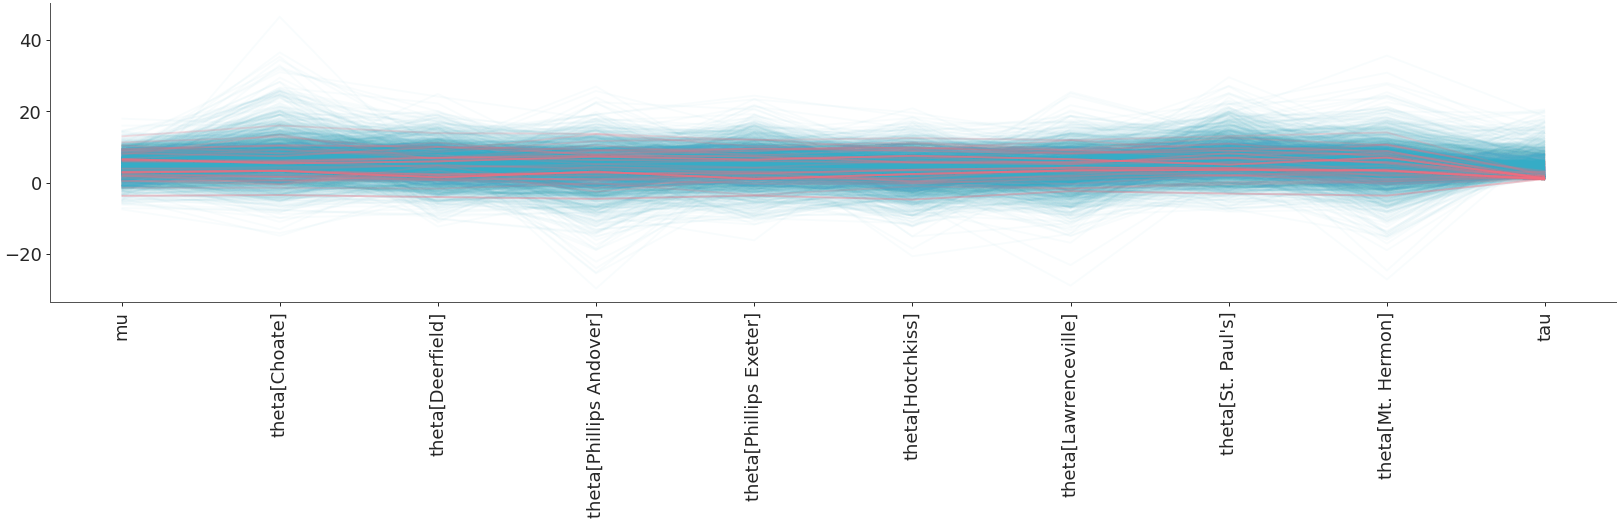
Default plot_parallel without normalization and with default label_type as “flat”.
>>> from arviz_plots import plot_parallel, style
>>> style.use("arviz-variat")
>>> from arviz_base import load_arviz_data
>>> dt = load_arviz_data('centered_eight')
>>> plot_parallel(dt)
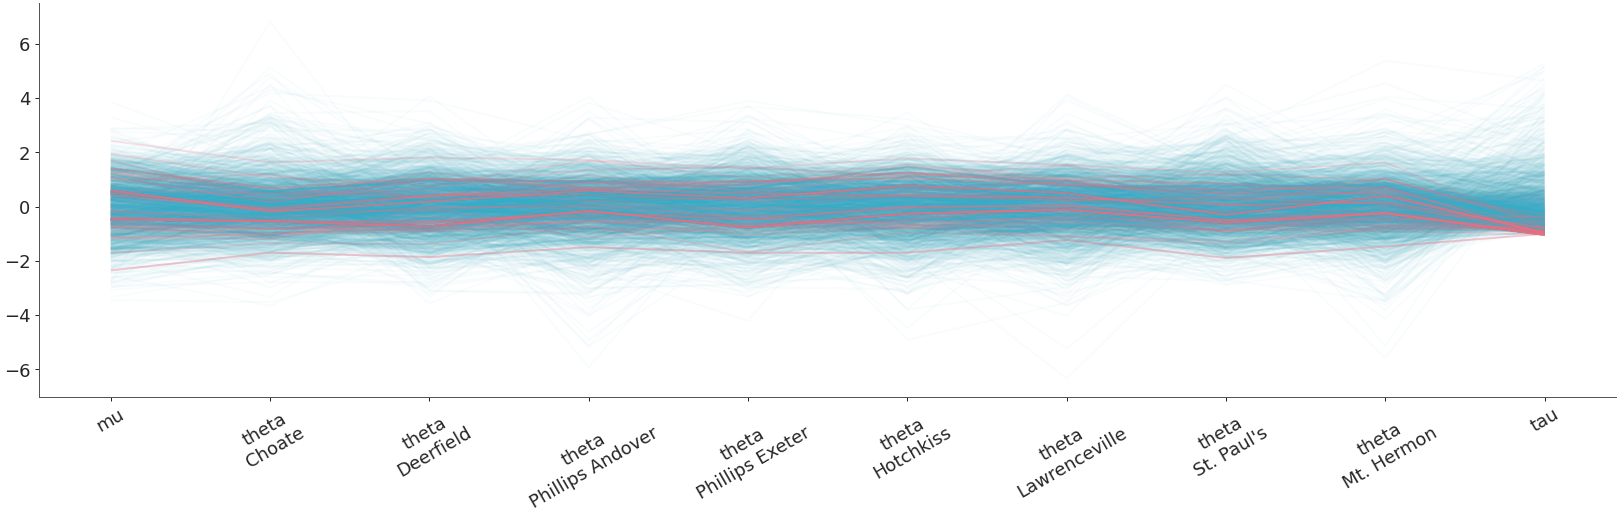
parallel_plot with norm_method set to “normal” and label_type set to “vert” and rotation of xaxis labels set to 30 degrees.
>>> plot_parallel(
>>>     dt,
>>>     norm_method="normal",
>>>     label_type="vert",
>>>     visuals={"xticks": {"rotation": 30}},
>>> )