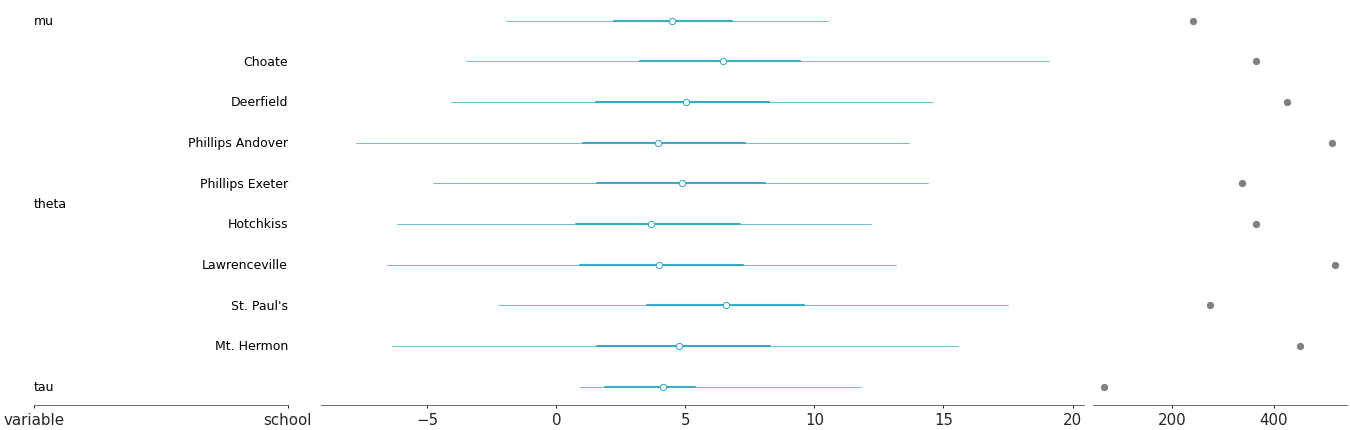
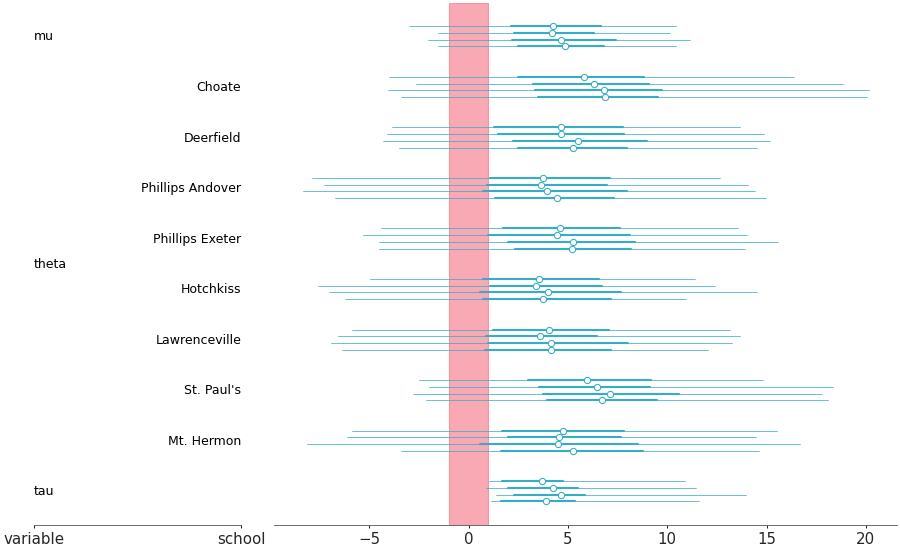
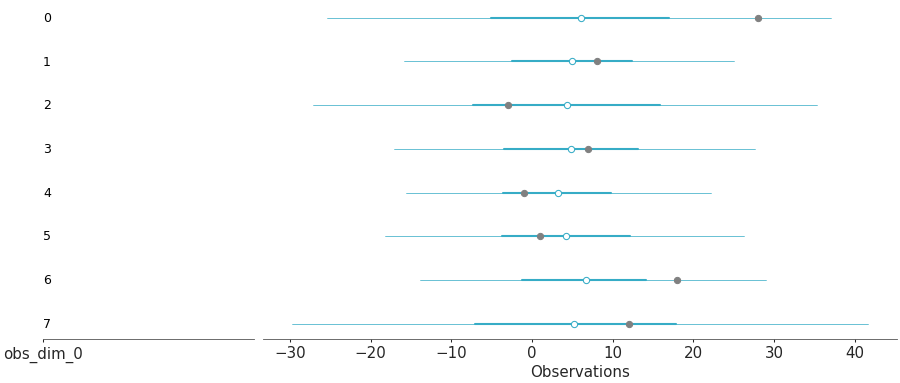
Posterior predictive forest and observations#
Overlay of forest plot for the posterior predictive samples and the actual observations
from arviz_base import load_arviz_data

import arviz_plots as azp

azp.style.use("arviz-variat")

idata = load_arviz_data("non_centered_eight")
pc = azp.plot_forest(
    idata,
    group="posterior_predictive",
    combined=True,
    labels=["obs_dim_0"],
    backend="none",  # change to preferred backend
)

pc.map(
    azp.visuals.scatter_x,
    "observations",
    data=idata.observed_data.ds,
    coords={"column": "forest"},
    color="gray",
)

pc.map(
    azp.visuals.labelled_x,
    "xlabel",
    coords={"column": "forest"},
    text="Observations",
    ignore_aes="y",
)
pc.show()
See also
API Documentation: plot_forest
Other examples with plot_forest#