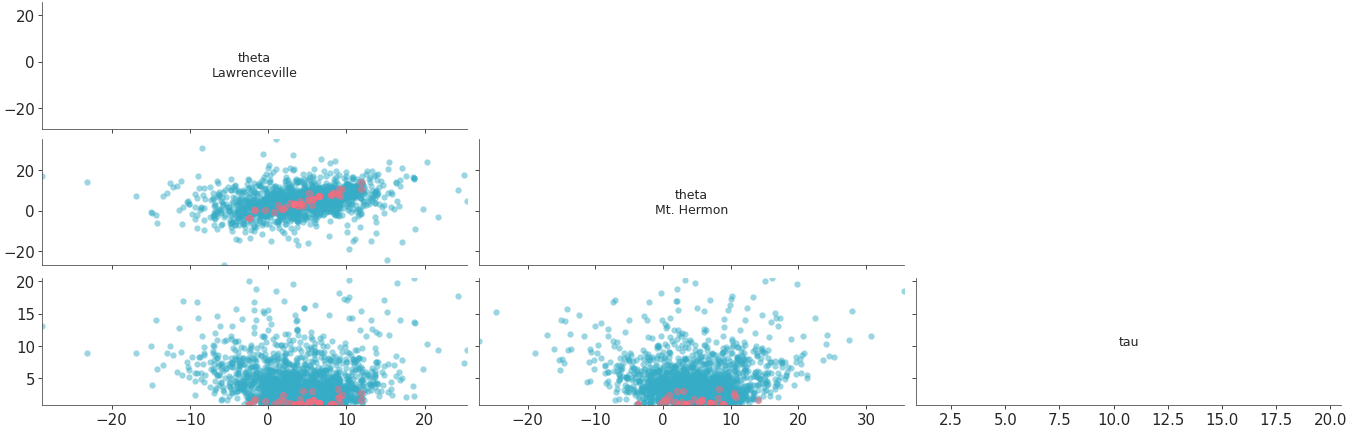
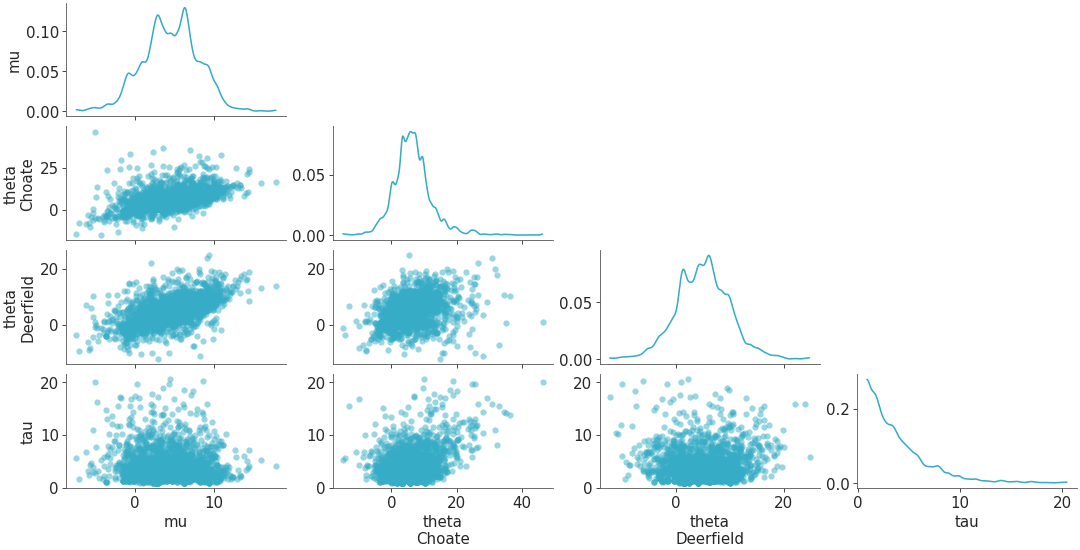
Scatterplot all variables against each other#
Plot all variables against each other in the dataset.
from arviz_base import load_arviz_data
import arviz_plots as azp
azp.style.use("arviz-variat")
data = load_arviz_data("centered_eight")
pc = azp.plot_pair(
data,
var_names=["mu","theta","tau"],
coords= {"school": ["Choate", "Deerfield"]},
backend="none", # change to preferred backend
)
pc.show()
See also
API Documentation: plot_pair
Other examples with plot_pair#