arviz_plots.plot_convergence_dist#
- arviz_plots.plot_convergence_dist(dt, diagnostics=None, grouped=True, ref_line=True, var_names=None, filter_vars=None, group='posterior', coords=None, sample_dims=None, kind='ecdf', point_estimate=None, ci_kind=None, ci_prob=None, plot_collection=None, backend=None, labeller=None, aes_by_visuals=None, visuals=None, stats=None, **pc_kwargs)[source]#
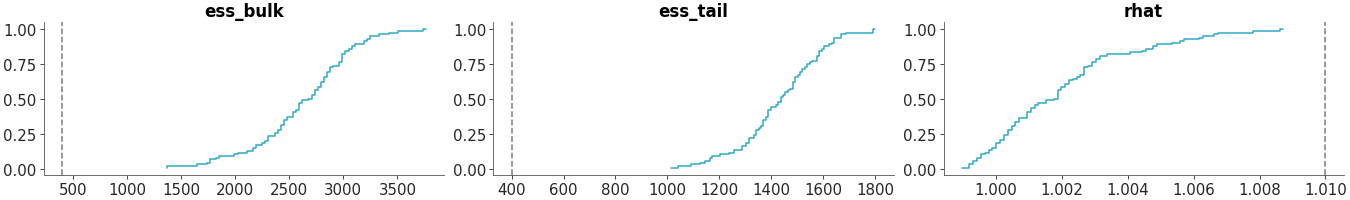
Plot the distribution of convergence diagnostics (ESS and/or R-hat).
By default all variables are grouped together and one plot per diagnostic is created. If you are interested in representing individual (multidimensional variables) pass them in var_names.
Information on how the diagnostics are computed can be found in [1].
- Parameters:
- dt
xarray.DataTree Input data
- diagnostics
listofstr, optional List of diagnostics to plot. Defaults to [“ess_bulk”, “ess_tail”, “rhat_rank”]. Valid diagnostics are “rhat_rank”, “rhat_folded”, “rhat_z_scale”, “rhat_split”, “rhat_identity”, “ess_bulk”, “ess_tail”, “ess_mean”, “ess_sd”, “ess_quantile”, “ess_local”, “ess_median”, “ess_mad”, “ess_z_scale”, “ess_folded” and “ess_identity”.
- grouped: bool, optional
Whether to plot all variables listed in
var_namestogether (True) or separately (False). Defaults to True. If False, all variables listed invar_namesmust be multidimensional.- ref_linebool, default
True Whether to plot a reference line for the recommended value of each diagnostic.
- var_names
strorlistofstr, optional One or more variables to be plotted. Prefix the variables by ~ when you want to exclude them from the plot.
- filter_vars{
None, “like”, “regex”}, default=None If None, interpret var_names as the real variables names. If “like”, interpret var_names as substrings of the real variables names. If “regex”, interpret var_names as regular expressions on the real variables names.
- group
str, default “posterior” Group to be plotted.
- coords
dict, optional The group for which to compute the convergence diagnostics.
- sample_dims
stror sequence of hashable, optional Dimensions to reduce unless mapped to an aesthetic. Defaults to
rcParams["data.sample_dims"]- kind{“kde”, “hist”, “dot”, “ecdf”}, optional
How to represent the distribution of diagnostics. Default to ecdf
- plot_collection
PlotCollection, optional - backend{“matplotlib”, “bokeh”, “plotly”}, optional
- labeller
labeller, optional - aes_by_visualsmapping of {
strsequence ofstr}, optional Mapping of visuals to aesthetics that should use their mapping in
plot_collectionwhen plotted. Valid keys are the same as forvisualsexcept for “remove_axis” By default, no mappings are defined for this plot.- visualsmapping of {
strmapping orFalse}, optional Valid keys are:
dist -> depending on the value of kind passed to:
ref_line -> passed to
vlinetitle -> passed to
labelled_titleremove_axis -> not passed anywhere, can only be
Falseto skip calling this function
- statsmapping, optional
Valid keys are:
dist -> passed to kde, ecdf, …
- **pc_kwargs
Passed to
arviz_plots.PlotCollection.wrap
- dt
- Returns:
References
[1]Vehtari et al. Rank-normalization, folding, and localization: An improved Rhat for assessing convergence of MCMC. Bayesian Analysis. 16(2) (2021) https://doi.org/10.1214/20-BA1221. arXiv preprint https://arxiv.org/abs/1903.08008
Examples
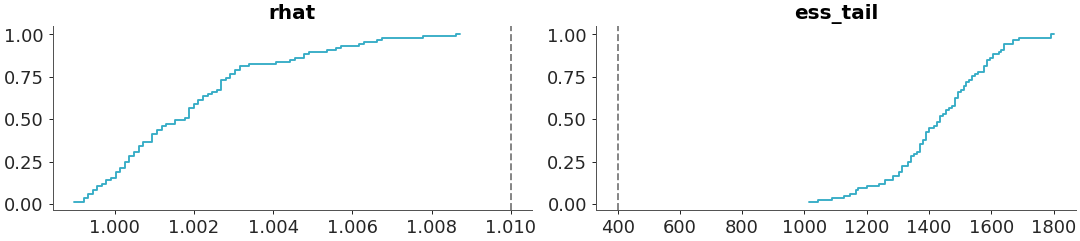
Select a single variable and specify diagnostics
>>> from arviz_plots import plot_convergence_dist, style
>>> style.use("arviz-variat")
>>> from arviz_base import load_arviz_data
>>> radon = load_arviz_data('radon')
>>> plot_convergence_dist(
>>>     radon,
>>>     var_names=["za_county"],
>>>     diagnostics=["rhat", "ess_tail"]
>>> )
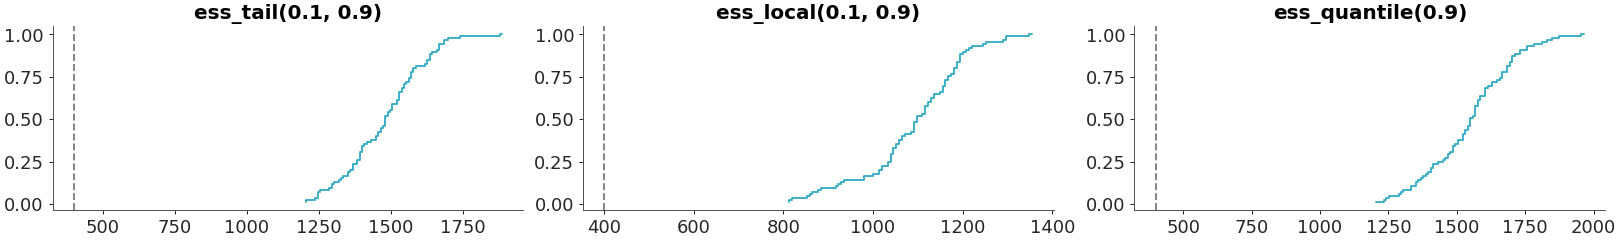
Some ess methods accepts a probability argument
>>> plot_convergence_dist(
>>>     radon,
>>>     var_names=["za_county"],
>>>     diagnostics=[
>>>         "ess_tail(0.1, 0.9)",
>>>         "ess_local(0.1, 0.9)",
>>>         "ess_quantile(0.9)"
>>>     ]
>>> )
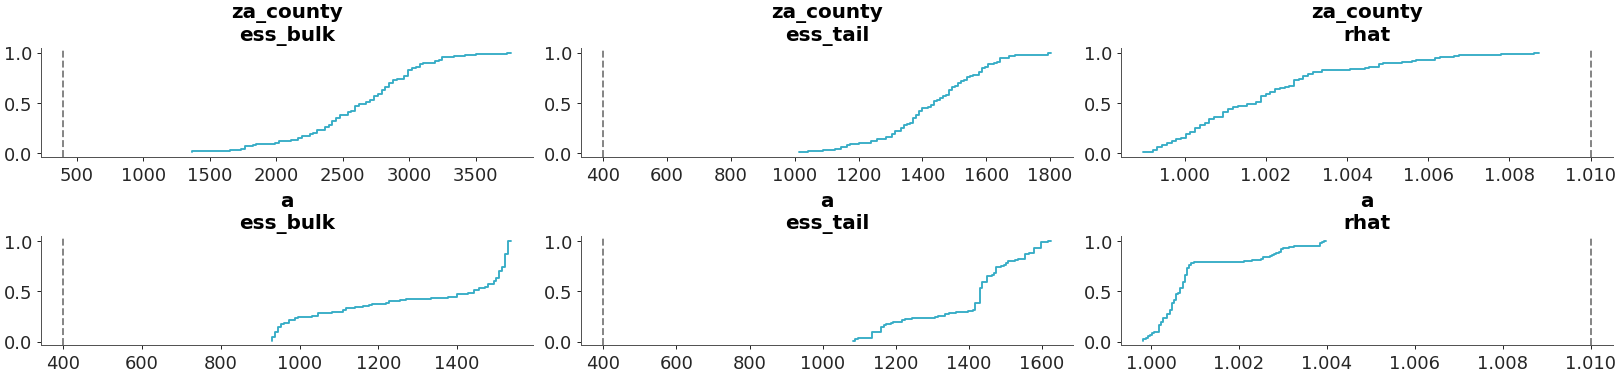
Select two variables and plot them separately
>>> plot_convergence_dist(
>>>     radon,
>>>     var_names=["za_county", "a"],
>>>     grouped=False,
>>> )